
Energy and Chemicals Planning
Feedstock, unit capacity and marine logistics decide what an energy or chemicals business can sell. DemandLabs plans them on one decision graph, with the margin of each decision in view.
Solutions for Energy and Chemicals
The DemandLabs applications that fit energy and chemicals planning, and how each one handles it.
Unit and line capacity solve with feedstock supply, and a planned outage can be tested as a scenario before the schedule is fixed.
Explore supply planningFeedstock, freight and tariff moves roll up to a landed cost and a recommended price for each account.
Explore revenue growth managementPort congestion and weather feeds score each lane and supplier, and a closed route can be taken offline in a scenario to see its effect on supply and revenue.
Explore supplier riskBuffers at plants, terminals and warehouses are re-solved each week against demand and lead-time variability.
Explore inventory optimizationScenario rooms compare margin and cash across plans, so a feedstock or price shift is decided in one review.
Explore IBPHow Energy and Chemicals Planning Connects
Feedstock and unit plans connect to the price each account pays and the margin it leaves.
Supply Plan
- Crude and feedstock
- Contracts
- Delivery schedule
Unit Plan
- Unit capacity
- Planned outages
- Co-products
Marine and Terminal
- Vessels
- Berths
- Tank capacity
Price and Contracts
- Landed cost
- Account pricing
- Take or pay
Margin
- Netback
- Working capital
- Emissions
Built for Energy and Chemicals
DemandLabs has an energy vertical alongside the six core applications.
Refinery and Marine Operations
The energy vertical covers refinery and marine operations on the same decision graph as supply and inventory.
Emissions Next to Margin
Emissions are planned in the same model as cost and margin.
Localisation Economics
Localisation and local content projects are assessed on cost and economic return next to the supply plan.
Cost Moves to Price
Feedstock, freight and tariff changes roll up to a landed cost and a recommended price action.
Energy and Chemicals Segments
How energy and chemicals planning differs by segment, with the applications that fit each one.
Oil and Gas
Well materials and spares across bases and field stores.
Explore the segmentRefining and Petrochemicals
Crude choice, unit plans and turnarounds priced on margin.
Explore the segmentChemicals
Campaigns, changeovers and formula prices on one plan.
Explore the segmentPower and Renewables
Project equipment risk and fleet spares on one plan.
Explore the segmentAgribusiness
Harvest, plant runs and sales commitments on one plan.
Explore the segmentPlanning Notes for Energy and Chemicals
See all notes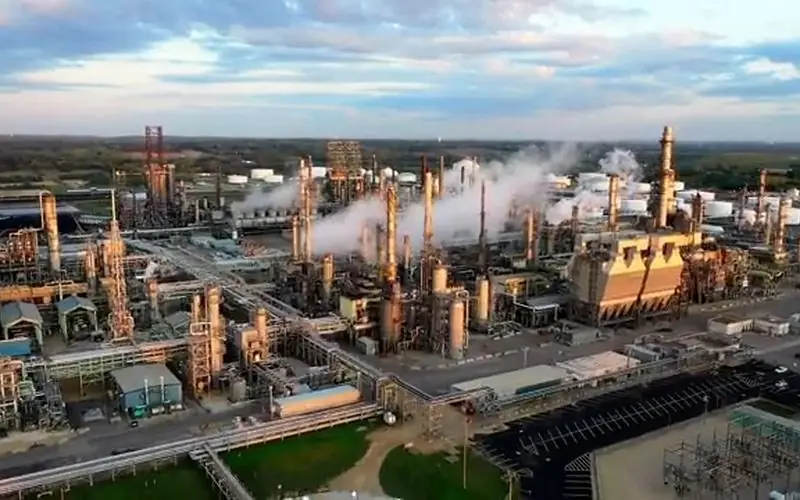
The gap between the monthly refinery plan and what the schedulers actually run
Refinery scheduling against a monthly plan built in averages: the tank coupling the plan cannot see, the pooling problem, and giveaway priced per day.
20 August 20269 min read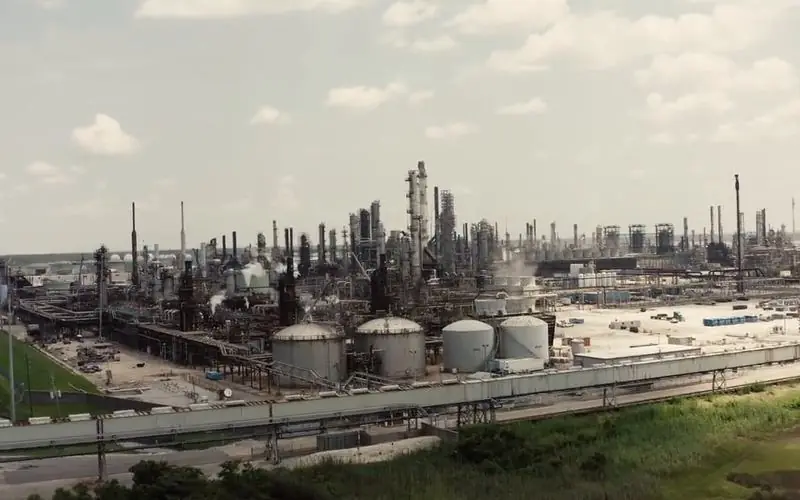
Cracker economics when the co-products decide the answer
Petrochemical margin optimisation when co-products carry a third of revenue: the three quantities called margin, feed choice, severity and transfer price.
23 August 20269 min read
Rescheduling a marine programme when the chokepoint closes
Tanker scheduling disruption as a priced decision: which commitments survive a chokepoint closure, what the alternatives cost, and how to prepare in advance.
30 September 20269 min readEnergy and Chemicals Planning FAQs
Does DemandLabs cover refinery and marine operations?
The energy vertical covers refinery and marine operations, along with emissions and localisation economics.
Can we pass feedstock and freight costs through to price?
Tariff and freight changes roll up to a landed cost and a recommended price action for each account.
Can we test a terminal or route going offline?
Scenarios take a site or lane offline and show the service and revenue impact before it happens.
How long does implementation take?
Eight weeks to the first live cycle for one planning area, with a value review with your CFO in week 10.
Other Industries






See Your Units and Margin on One Graph
A 45-minute walkthrough on your own data.